Business
About Us
Education status of executives and employees

Required Training
for Employees
Training to prevent sexual harassment
Creating a healthy workplace that is free from sexual harassment
Number of trained staff 204
Ethical management education
Ethical awareness that responsible corporate executives and employees must learn
Number of trained staff 203
Education to improve awareness of the disabled in the workplace
Education to improve awareness of the disabled in the workplace
Number of trained staff 196
Education on information security
Stressing the importance and safety of personal information protection
Number of trained staff 197
Training to prevent bullying in the workplace
Raising awareness to create a mutually respectful working environment
Number of trained staff 204
Education on subcontracting law
Providing education on subcontracting law to ensure fair trade and create a healthy subcontracting environment
Number of trained staff 27
Education on retirement pension
Providing education on retirement pension to ensure a stable retirement for executives and employees
Number of trained staff 197

Training by
Position/Rank
Leadership program
Leadership training for team leaders/ part leaders
Number of trained staff 18 Satisfaction with education 65%
Training courses for promoted persons
New roles and changes in responsibilities
Number of trained staff 20 Satisfaction with education 90%
Enhancing the expertise of outside directors
Providing education to develop the expertise of outside directors
Number of trained staff 5
※ Training satisfaction measurement: Positive response rate (response rate of 4 or higher out of 5)

Common
competency training
for employees
New employee onboarding training
Onboarding for employees who joined the company (new/experienced) to adapt to the organization
Number of trained staff 37 Satisfaction with education 100%
Language education
Supporting the use of educational platforms to improve conversational language skills
Number of trained staff 110
Overseas Cultural Experience course
This course is intended to foster a global mindset and encourage a workplace culture of learning and dedication.
Number of trained staff 5
※ Training satisfaction measurement: Positive response rate (response rate of 4 or higher out of 5)
※ For repeating students, the number of repeats is also counted.

Competency Training
by Job
External job training
Providing training programs offered by outside experts to improve job capabilities
Number of trained staff 24
Job training for partners
Providing training to partners to improve their job capabilities
Number of trained staff 54
Online job training
Support for using online education platform to enhance employees’ job capabilities
Number of trained staff 73
※ For repeating students, the number of repeats is also counted.
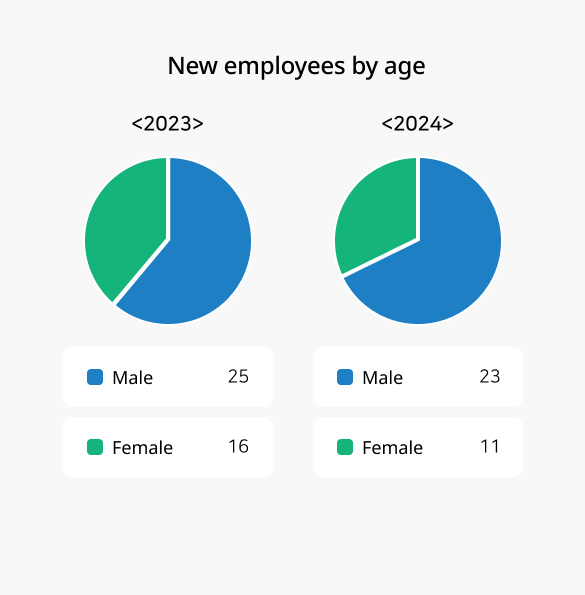
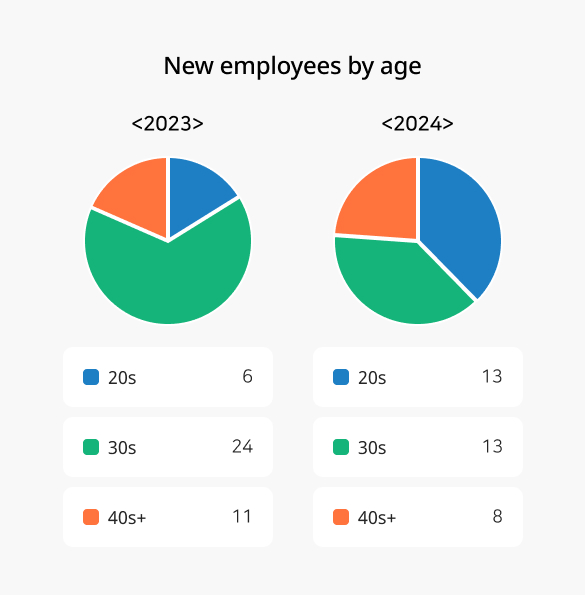
Diversity of employees
※ Solus iTech is included.
Diversity of employees
| Classification | Unit | 2023 | 2024 | |||
|---|---|---|---|---|---|---|
| Persons | Ratio | Persons | Ratio | |||
| Total | Persons, % | 196 | 100% | 214 | 100% | |
| Male | Persons, % | 152 | 78% | 162 | 76% | |
| Female | Persons, % | 44 | 22% | 52 | 24% | |
| Total | Persons, % | 196 | 100% | 214 | 100% | |
| 20s | Persons, % | 16 | 8% | 24 | 11% | |
| 30s | Persons, % | 90 | 46% | 89 | 42% | |
| 40s | Persons, % | 61 | 31% | 69 | 32% | |
| 50s or older | Persons, % | 29 | 15% | 32 | 15% | |
| Total | Persons, % | 196 | 100% | 214 | 100% | |
| Master degree or higher | Persons, % | 54 | 28% | 52 | 24% | |
| College degree | Persons, % | 88 | 45% | 110 | 51% | |
| Junior college degree or less | Persons, % | 54 | 28% | 52 | 24% | |
| Total | Persons, % | 196 | 100% | 214 | 100% | |
| Executives | Persons, % | 11 | 6% | 13 | 6% | |
| Clerical | Persons, % | 131 | 67% | 146 | 68% | |
| Technical | Persons, % | 47 | 24% | 47 | 22% | |
| Other positions | Persons, % | 7 | 4% | 8 | 4% | |
| Total | Persons, % | 44 | 22% | 52 | 24% | |
| Entry-level to assistant managers | Persons, % | 24 | 34% | 28 | 37% | |
| Managers | Persons, % | 13 | 23% | 15 | 27% | |
| Deputy department heads | Persons, % | 4 | 16% | 6 | 15% | |
| Department heads to deputy managing directors | Persons, % | 3 | 9% | 3 | 10% | |
| Executives | Persons, % | 0 | 0% | 0 | 0% | |
※ Executives: Outside directors and auditors
※ Other positions: specialized job
※ Proportion of women: Ratio of female workers to the total number of employees by position
※ Solus iTech is included.
Turnover rate indicator
| Classification | Unit | 2023 | 2024 | |||
|---|---|---|---|---|---|---|
| Persons | Ratio | Persons | Ratio | |||
| Turnover status | Number of staff turnover | Persons, % | 31 | 100% | 17 | 100% |
| Number of voluntary turnover | Persons, % | 31 | 100% | 17 | 100% | |
※ Excluding transfers between divisions and subsidiaries.
※ Voluntary turnover: When an employee leaves due to personal reasons other than retirement or dismissal
※ Voluntary turnover rate: Percentage of voluntary turnover based on current employees
※ Solus iTech is included.